Authentic russian infographics since 1912
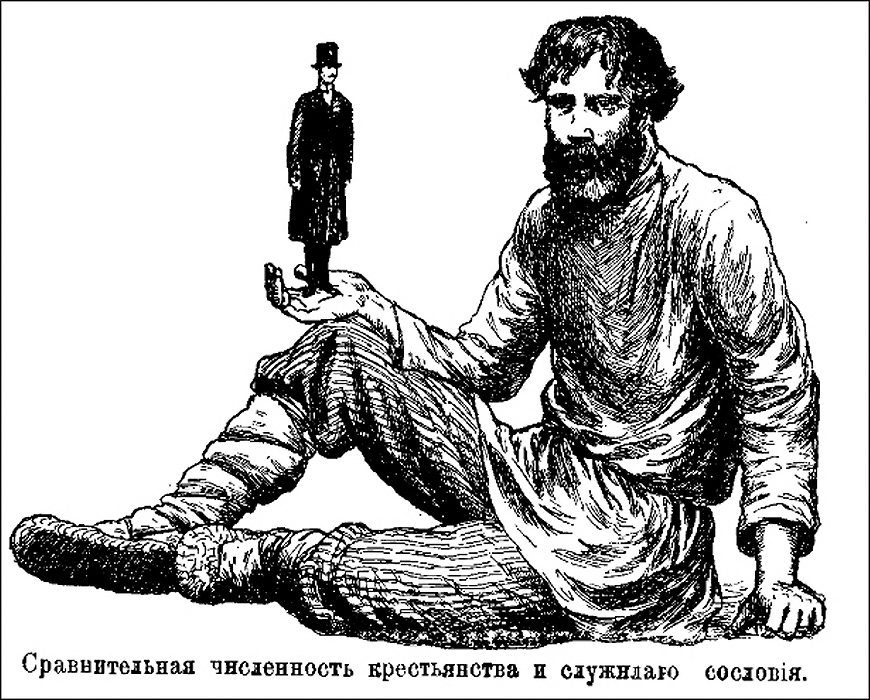
The first population census after The Russian Revolution of 1917 dated August 28, 1920. As the civil war still went on, the census covered only 72% of the population. Eight years earlier, in 1912 Nikolai Rubakin published a book “Russia in numbers. Country. People. Estates. Classes.”, that contained different statistics devoted to the Russian Empire of those days. These pictures can be treated as the first Russian infografics.The first picture refers to the relative number of the peasants to the employees.
Nikolai Rubakin

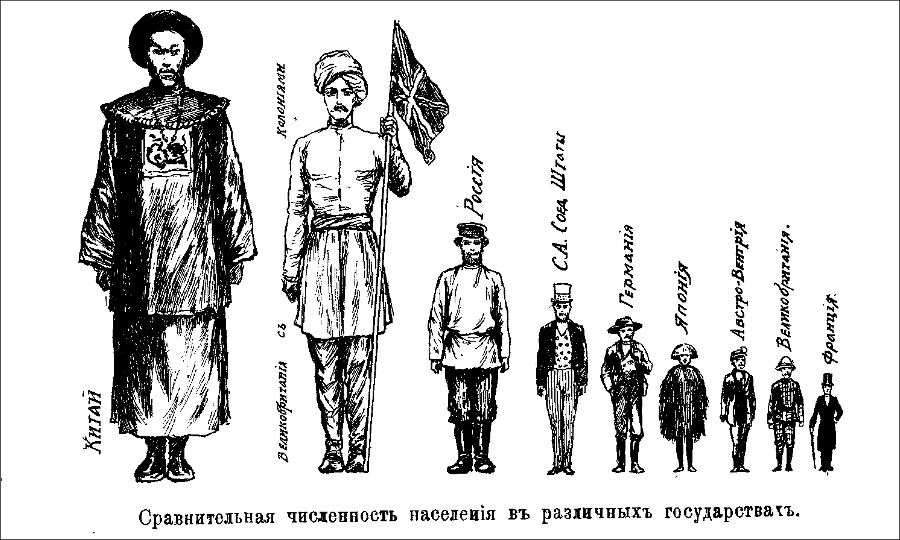
Population1) China2) Great Britain with colonies3) Russia4) USA5) Germany6) Japan7) Austria8) Great Britain without colonies9) France
Nikolai Rubakin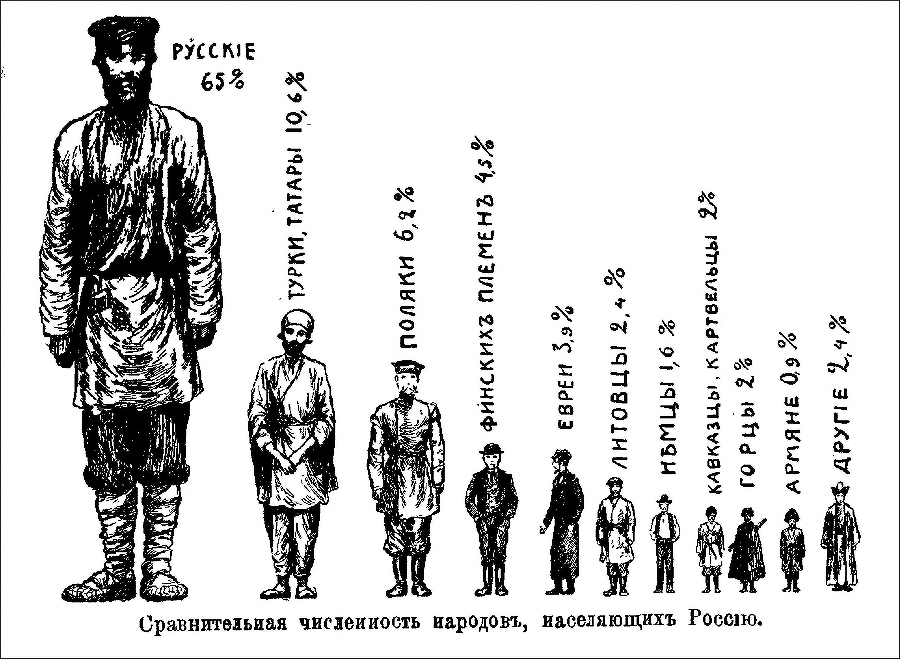
Nationality distribution of Russian EmpireRussians 65%Turks and Tatars 10,6%Polacks 6,2%Finnish tribes 4,5%Jewry 3,9%Lithuanians 2,4%Germans 1,6%Caucasians 2%Mountaineers 2%Armenians 0,9%Others 2,4%
Nikolai Rubakin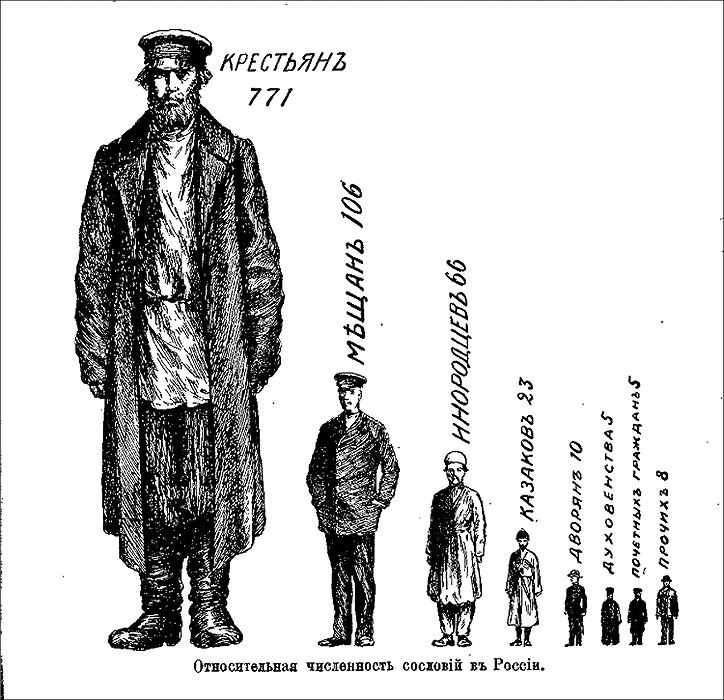
Social classes (per 1000)Peasants - 771Beaurgeois - 106Indigenous dwellers - 66Cossacks - 23Nobility - 10Clergy – 5Senior citizen - 5Others - 8
Nikolai Rubakin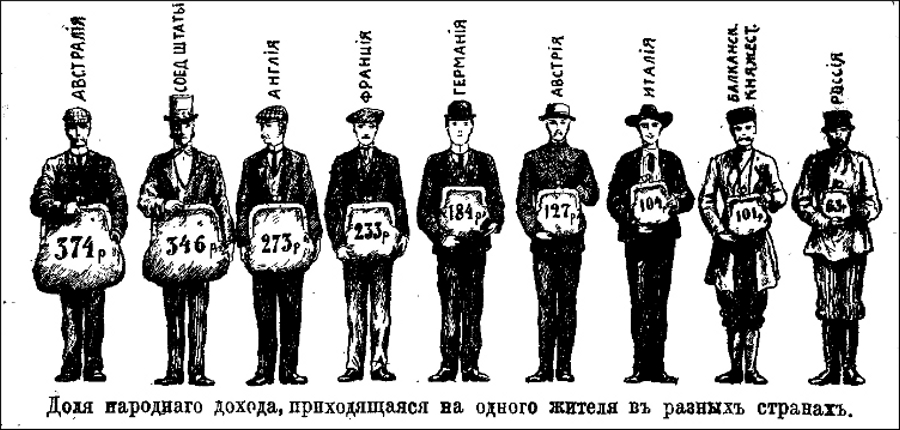
Income per capitaAustralia – 374 rublesUSA – 346 rublesEngland – 273 rublesFrance - 233 rublesGermany - 184 rublesAustria - 127 rublesItaly - 104 rublesBalkan principality - 101 rublesRussia - 63 rubles
Nikolai Rubakin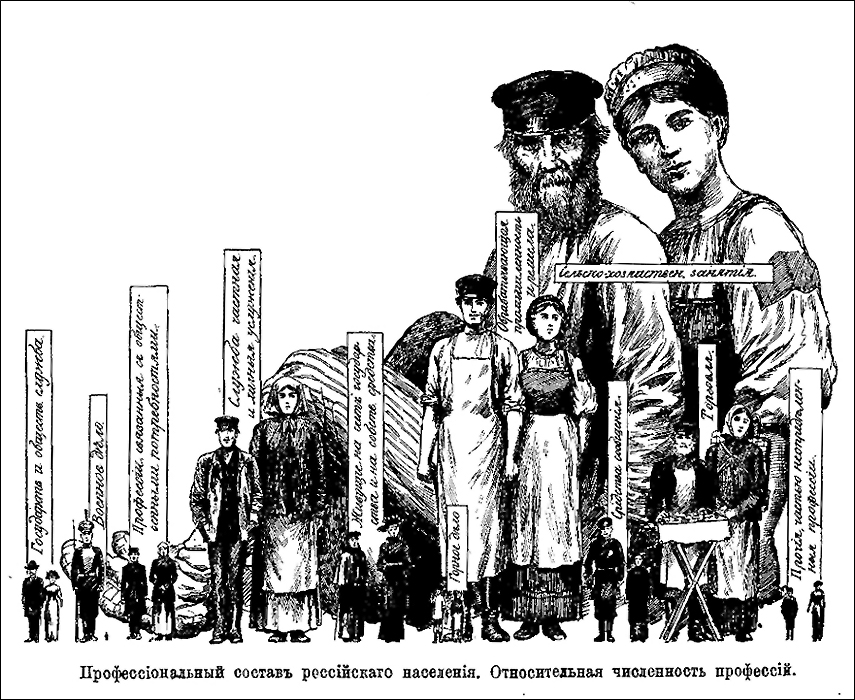
Population by profession1) Farming sector2) Manufacturing industry3) Trade4) Private services5) Soldiery6) Publicly-funded & those who live at its own expense7) Means of communication8) Profession connected to the social needs9) Сivil service10) Mining engineering11) Other professions
Nikolai Rubakin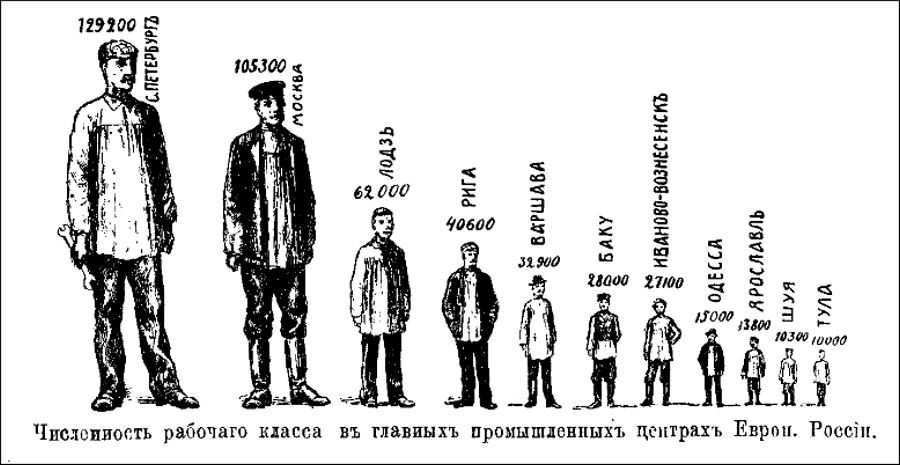
The quantity of the factory workers in the main industrial centresSaint Petersburg 129.200Moscow 105.300Lodz 62.000Riga 40.600Warsaw 32.900Baku 28.000Ivanovo-Voznesensk 27.100Odessa 15.000Yaroslavl 13.800Shuya 10.300Tula 10.000
Nikolai Rubakin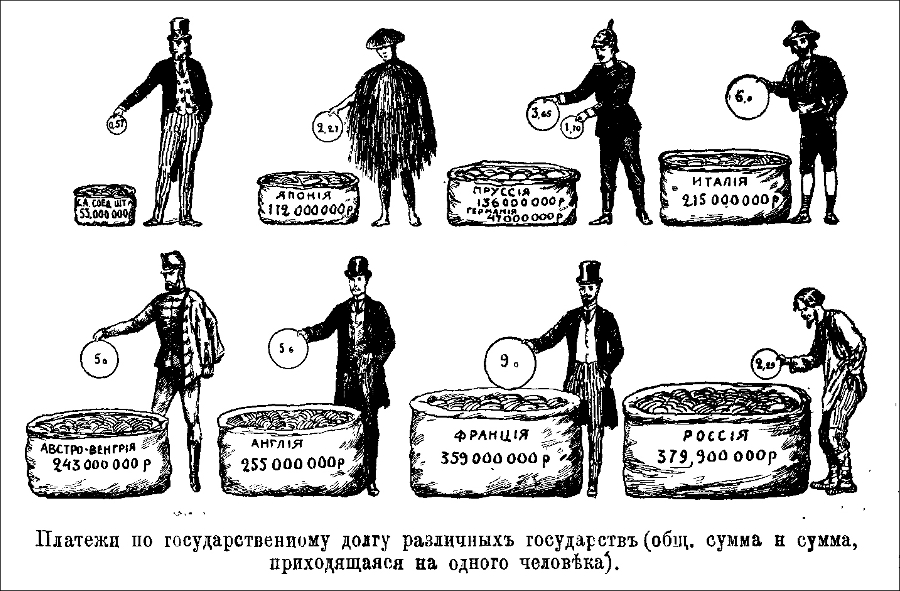
State debt paymentsUSA 53.000.000 rubles of debt / 2.57 rubles contributed per personJapan 112.000.000 rubles of debt / 2.24 rubles contributed per person Prussia 136.000.000 rubles of debt, Germany - 47.000.000 / 3.65 rubles and 1.10 rubles consequently contributed per personItaly 215.000.000 rubles of debt / 6 rubles contributed per personAustro-Hungary 243.000.000 rubles of debt / 50 rubles contributed per personEngland 255.000.000 rubles of debt / 56 rubles contributed per personFrance 359.000.000 rubles of debt / 90 rubles contributed per personRussia 379.900.000 rubles of debt / 2,29 rubles contributed per person
Nikolai Rubakin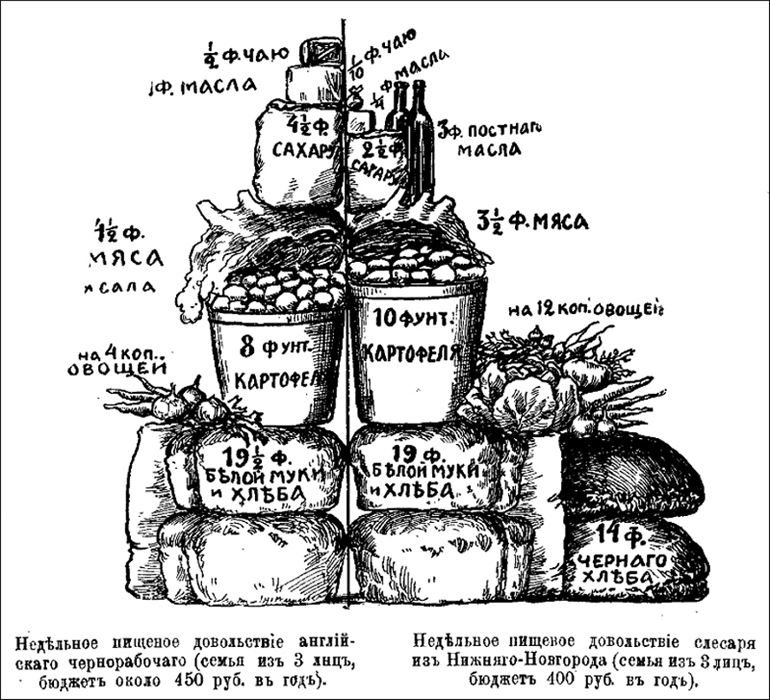
Consumption basket: English worker vs. Russian workerWeekly alimentary allowance of English worker (family of 3 persons with 450 rubles' budget per year):19.5 lb. of flour and wheat bread8 lb. of potatovegetables for 4 kopeiks4.5 lb. of meat and bacon4.5 lb. of sugar0.5 lb. of tea1 lb. of butterWeekly alimentary allowance of Russian worker (family of 3 persons with 400 rubles' budget per year):19.5 lb. of flour and wheat bread14 lb. of rye bread10 lb. of potatovegetables for 12 kopeiks3.5 lb. of meat and bacon2.5 lb. of sugar0,01 lb. of tea0,25 lb. of butter
Nikolai Rubakin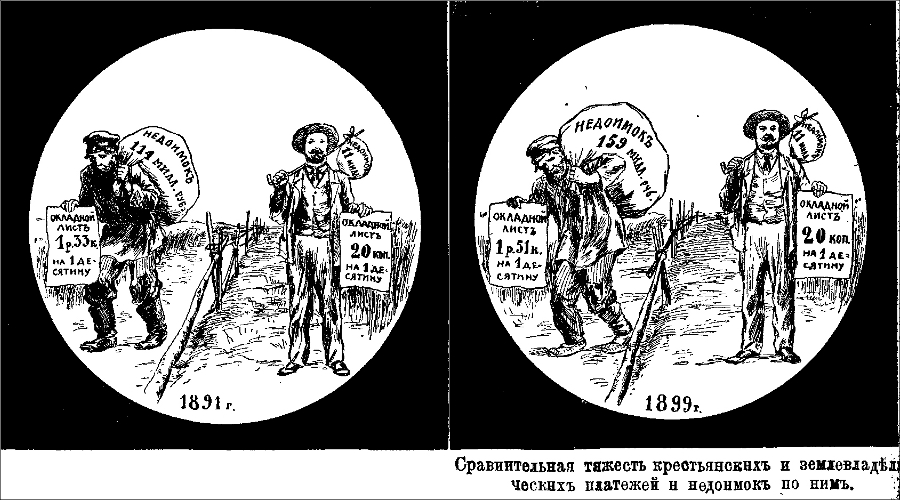
Relative amount of payments made by the peasants and the landowners relatively as well as the comparative percentage of the arrears1) 1891A peasant paid 1 rouble 33 copecks for 1,1 hectare, arrears - 114 million roublesA landowner paid 20 copecks for 1,1 hectare, arrears - 11 million roubles2)1899A peasant paid 1 rouble 51 copecks for 1,1 hectare, arrears - 159 million roublesA landowner paid 20 copecks for 1,1 hectare, arrears - 11 million roubles
Nikolai Rubakin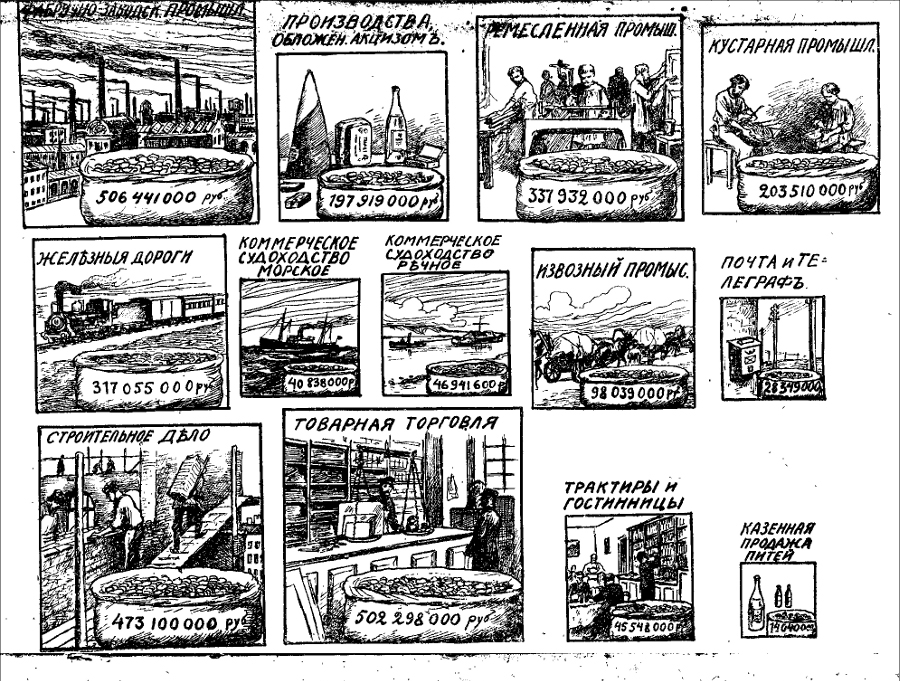
Company yieldsFactories 506.441.000 rublesExcise-taxed industries 197.919.000 rublesHandcrafts 337.932.000 rublesArtisans 203.510.000 rublesRailroad communications 317.055.000 rublesCommercial sea-shipping 408.380.00 rublesCommercial river-shipping 46.941.600 rublesCabbing 98.039.000 rublesPost & Telegraph 28.349.000 rublesReal estate development 473.100.000 rublesRetail 502.298.000 rublesInns & hotels & pubs 45.548.000 rublesState food sales 14.640.093 rubles
Nikolai Rubakin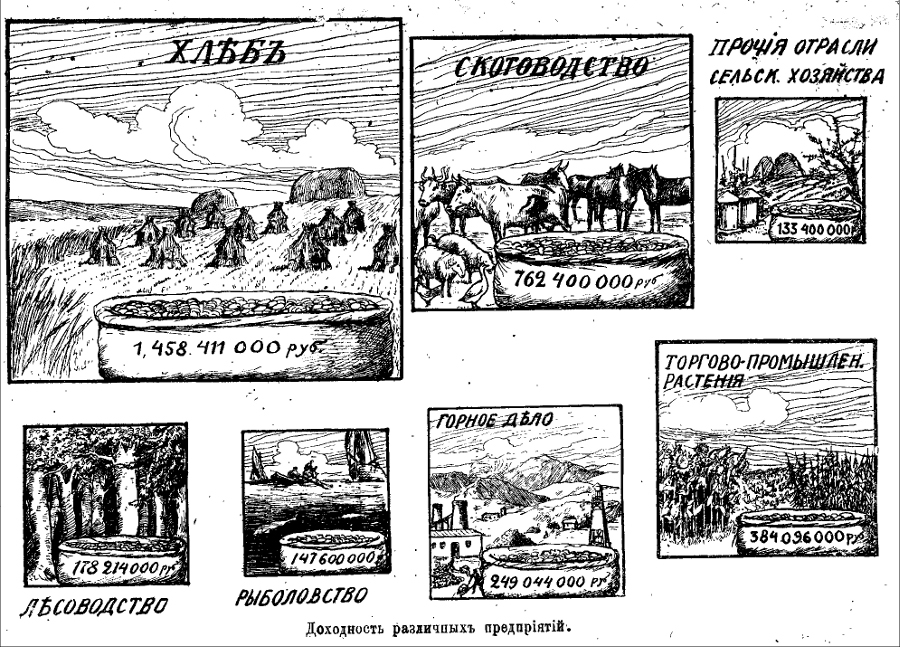
...Bread 1.458.411.000 rublesCattle breeding 762400.000 rublesOther agricultural fields 133.400.000 rublesForest management 178.214.000 rublesFishery 147.600.000 rublesMining engineering 249.044.000 rublesPlants 384.096.000 rubles
Nikolai Rubakin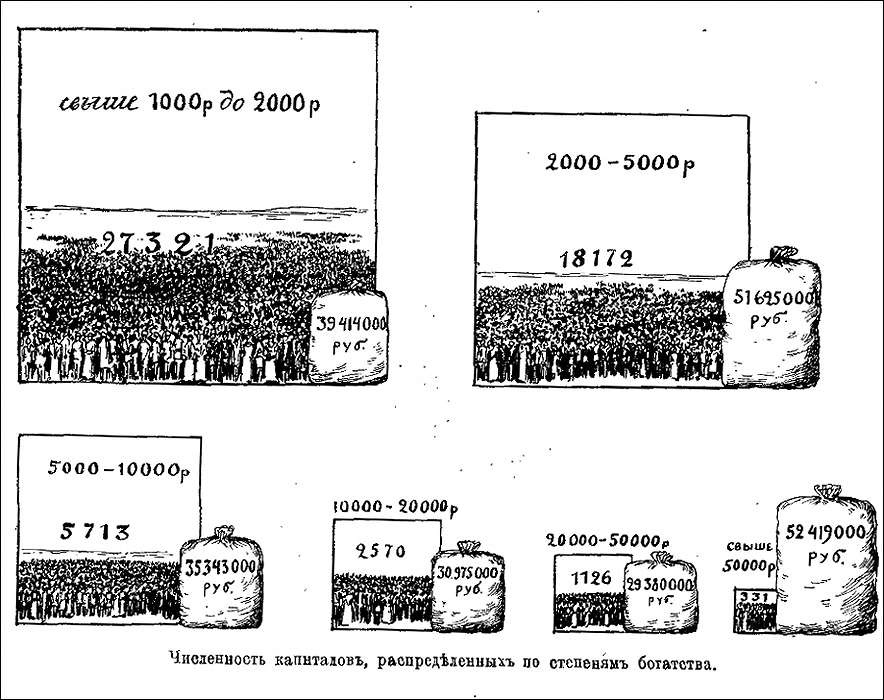
Distribution of the funds according to the social group1) Income per person: More than 1.000 roubles - 2.000 roubles / 27.321 people in the group / total income: 39.414.000 rubles2) Income per person: 2.000 roubles – 5.000 roubles / 18.172 people in the group / total income: 51.625.000 rubles3) Income per person: 5.000 roubles – 10.000 roubles / 5.713 people in the group / total income: 35.343.000 rubles4) Income per person: 10.000 roubles – 20.000 roubles / 2.570 people in the group / total income: 30.975.000 rubles5) Income per person: 20.000 roubles– 50.000 roubles / 1.126 people in the group / total income: 29.380.000 rubles6) Income per person: More than 50.000 roubles / 331 people in the group / total income: 52.419.000 rubles
Nikolai Rubakin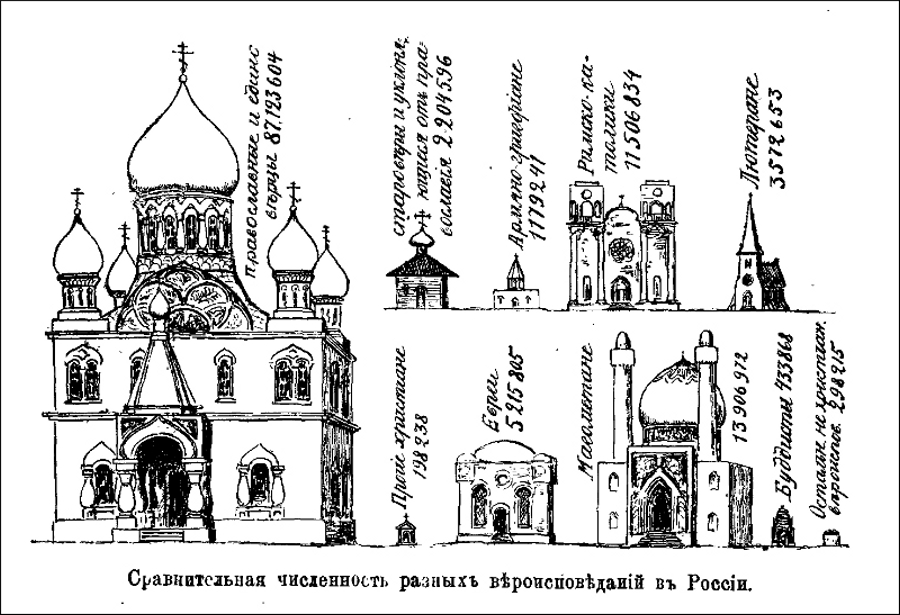
Confessions in the Russian EmpireOrthodox Church and adherents - 87.123.604Old Ritualists - 2.204.596Armenian Gregorian Church - 1.179.241Roman Catholics - 11.506.834Lutherans - 3.572.653Other christians - 198.238Hebrews - 5.215.805Islamites -13.906.972Buddhists – 433.868Others – 298.215
Nikolai Rubakin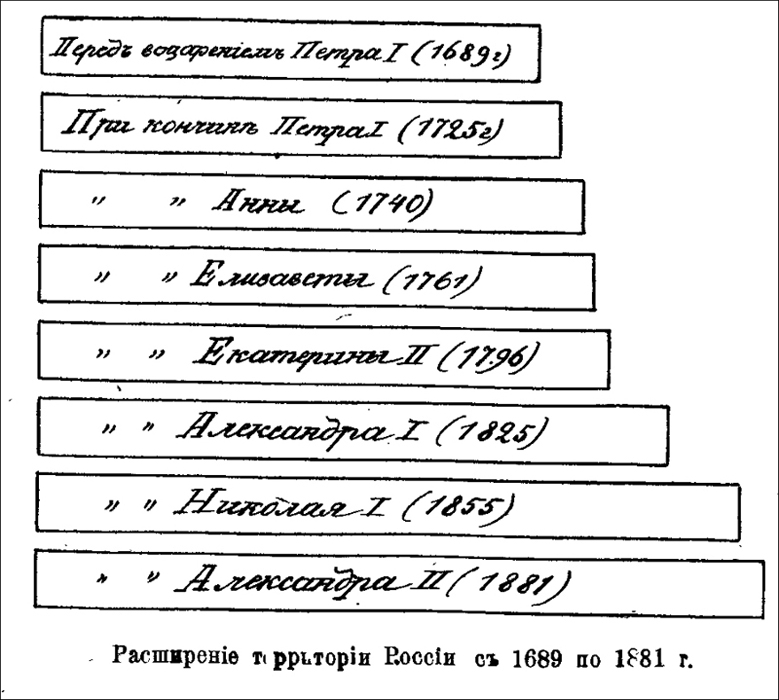
Territorial expansion 1689-18811) Before Peter I (1689)2) After Peter I (1725)3) After Anne (1740)4) After Elisabeth (1761)5) After Ekatherine II (1796)6) After Alexander I (1825)7) After Nikolai I (1855)8) After Alexander II (1881)
Nikolai Rubakin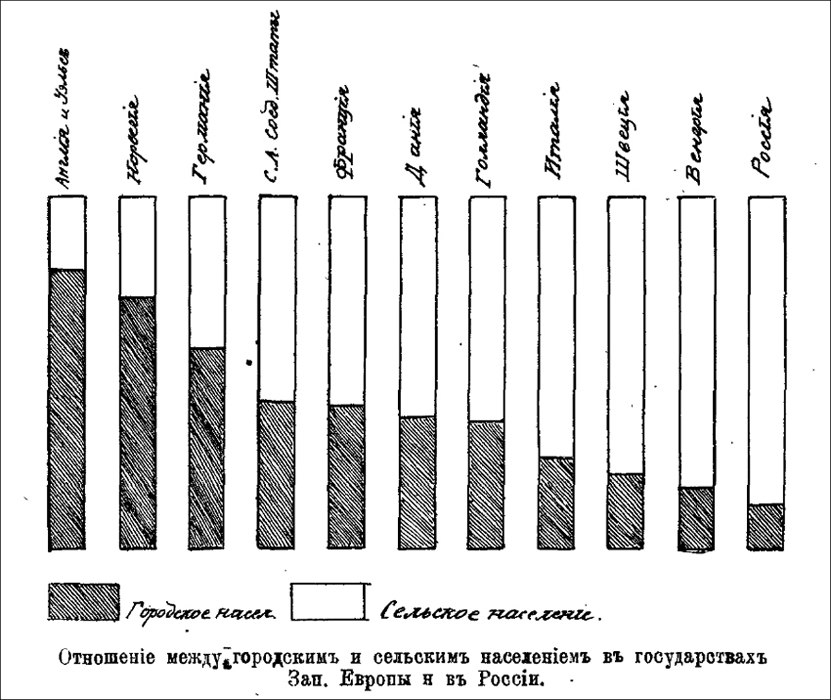
Balance between urban population and rural population in the Russian Empire and Western Europe1) England & Wales2) Norway3) Germany4) USA5) France6) Denmark7) Holland8) Italy9) Sweden10) Hungary11) Russia
Nikolai Rubakin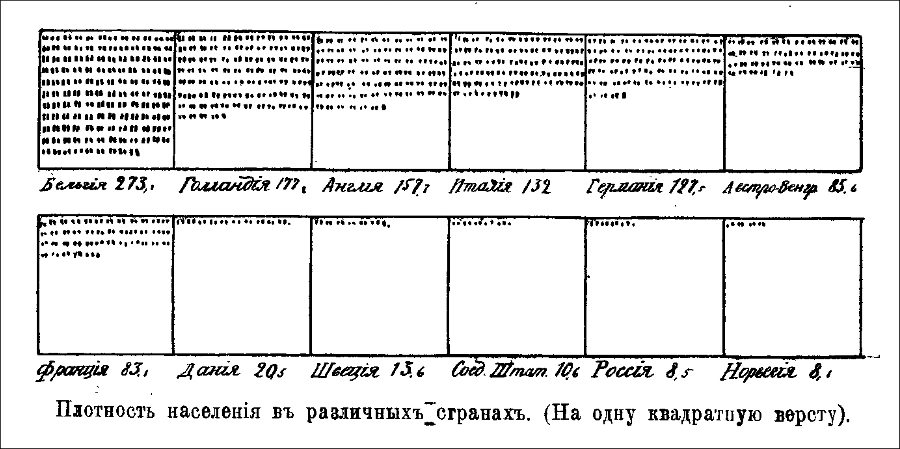
Population density (per square mile)Belgium 273Holland 177England 157Italy 132Germany 127,5Austro-Hungary 85,6France 83,8Denmark 20,5Sweden 13,6USA 10,6Russia 8,5Norway 8,1
Nikolai Rubakin
Mortality (per 1000 people)Sweden - 9.2Denmark - 14.6England & Wales - 15Switzerland - 17Germany – 19.4Russia – 31.5Italy – 22.2France - 19USA - 18Norway – 14.6South Wales - 10
Nikolai RubakinSubscribe
to our newsletter!
Get the week's best stories straight to your inbox